The financial case for commercial solar cleaning is often presented in theoretical terms — industry average soiling rates, estimated output losses, rough cost-benefit estimates. This post presents verified real-world data from an actual Bay Area commercial facility that has maintained a consistent professional cleaning program and tracked production across multiple years.
Note: Facility details are anonymized at the client's request. Production data is drawn from 99 months of verified commercial solar monitoring records.
The Facility and System
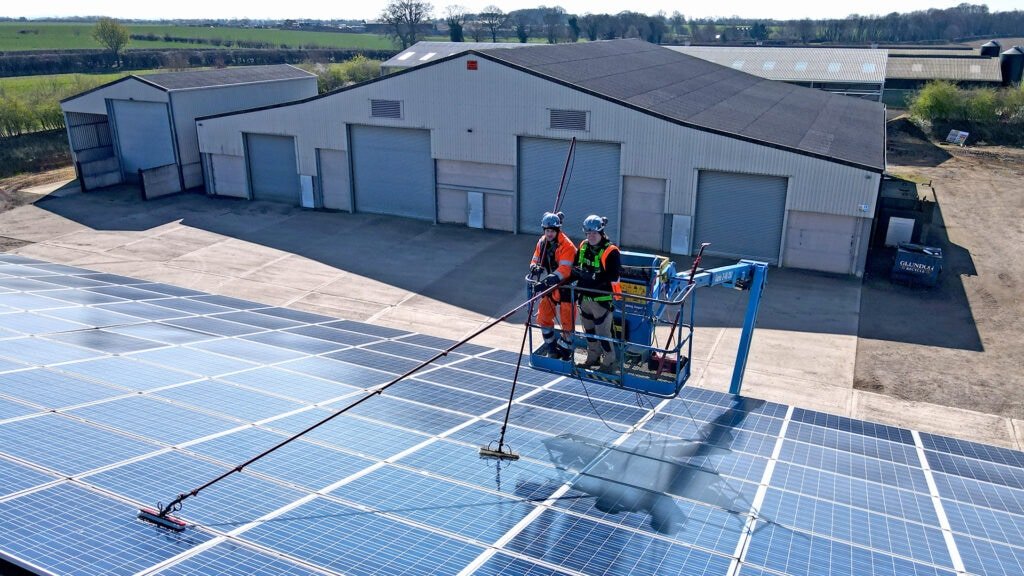
The facility is a Bay Area commercial property with a significant rooftop solar installation. The system has been monitored continuously through a commercial solar platform since January 2018 — providing one of the most complete long-term solar production datasets available in the region.
The facility began a recurring professional cleaning program with bi-annual service (spring and fall). Prior to this program, cleaning was inconsistent — occasional and reactive rather than scheduled.
What the Production Data Shows
October was selected as the comparison month because it represents a high-value production window in the Bay Area — strong sun, high utility rates during peak hours, and typically the first month after the main fire season cleaning.
| Year | October Production | vs. Pre-Program Baseline | Notes |
|---|---|---|---|
| 2023 — Baseline Year | 20,023 kWh | — | Pre-recurring program baseline |
| 2024 — Year 2 of Program | 24,941 kWh | +24.6% | Post-cleaning, sustained gain |
| 2025 — Year 3 of Program | 25,081 kWh | +25.3% | Gains sustained into second year |
Why These Numbers Are Significant
The 24–25% production gain is striking — but what's more significant is that the gains were sustained across two consecutive years, not just a one-time spike. This matters for several reasons:
- A one-time spike might be attributable to weather variation or equipment changes
- Sustained multi-year gains point to a structural improvement in system performance
- The consistency of the results across two years aligns with published industry research on soiling recovery from professional cleaning (typically 10–30% depending on soiling severity and interval)
📊 Industry context: Published research from NREL (National Renewable Energy Laboratory) and other institutions consistently documents soiling losses of 10–25% in California commercial solar systems. The observed recovery at this facility falls squarely within published ranges — reinforcing the validity of the production data.
The Financial Analysis
Translating production data into financial impact requires context about utility rates, system size, and export value. The following represents a conservative estimate based on this facility's operational profile:
| Metric | Current (No BESS) | Future (With Battery Storage) |
|---|---|---|
| Annual cleaning cost | $6,000 | $6,000 |
| Estimated annual production benefit | $10,000–$14,000 | $14,000–$18,000 |
| Simple payback period | 4–5 months | 3–4 months |
| Annual net benefit | $4,000–$8,000 | $8,000–$12,000 |
Battery storage scenario adds peak-rate shaving and solar time-shifting benefits. Production benefit includes direct utility bill offset and solar export value.
The Condition-Based Cleaning Strategy
One of the most valuable insights from this facility's data is the case for condition-based scheduling rather than purely calendar-based service.
Rather than cleaning on fixed dates regardless of system status, a data-driven approach considers:
- Seasonal pollen decline (clean after pollen season peaks)
- Visible dust accumulation (visual inspection triggers)
- Recent rain activity (post-rain mineral deposits)
- Observed production trends (monitoring data indicates when cleaning is needed)
- Wildfire and smoke events (immediate response cleaning)
This approach maximizes the value of each cleaning dollar by timing service when it delivers the greatest marginal production benefit.
What This Means for Your Commercial Solar System
Every commercial solar system is different — panel count, tilt angle, geographic location, surrounding environment, and utility rate structure all affect the precise ROI of professional cleaning. But the fundamental conclusion from this data is consistent with industry research and our experience across hundreds of Bay Area commercial properties:
Professional solar cleaning on a consistent schedule is one of the highest-ROI maintenance investments available to commercial solar owners. The cleaning cost is recovered in 3–5 months. Every subsequent month of the year is pure net benefit.
🎯 For commercial solar owners: If you aren't on a regular professional cleaning program, your system is almost certainly underperforming. Get a free quote, review your production data from the past 12 months, and calculate what a 15–25% production recovery would mean to your bottom line.
Get Your Commercial System Assessed
We provide free site assessments for commercial solar systems throughout the Bay Area. We'll review your production data, assess your current soiling level, and provide a custom cleaning program recommendation with projected ROI — at no cost.